# Debugger Component

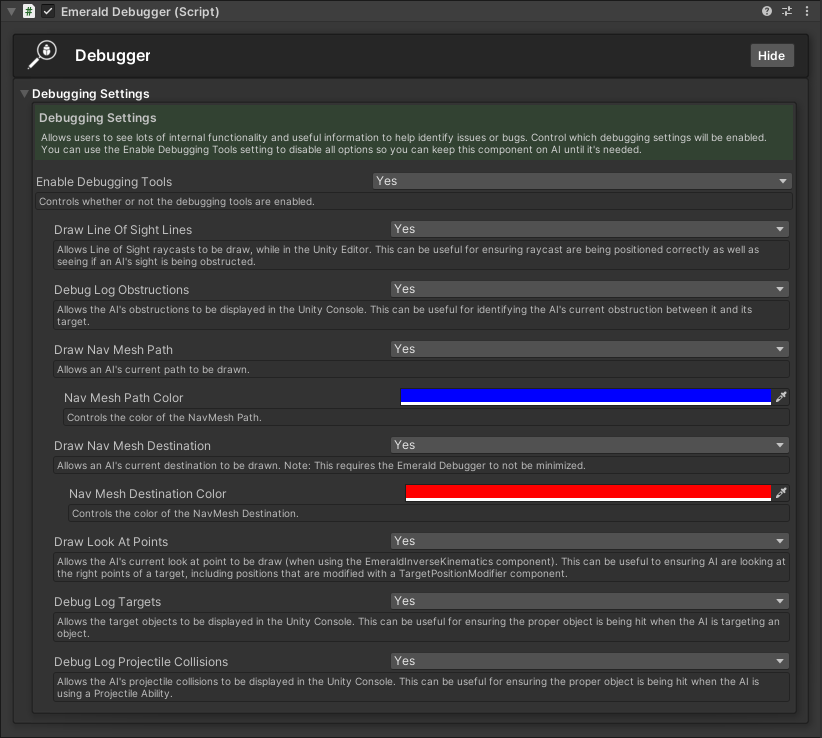
<figure><img src="/files/QY3la53OEAjdRiO5cI48" alt=""><figcaption><p>The Emerald Debugger Component. Pressing the foldout area will expand its options.</p></figcaption></figure>

## Using the Debugger Component

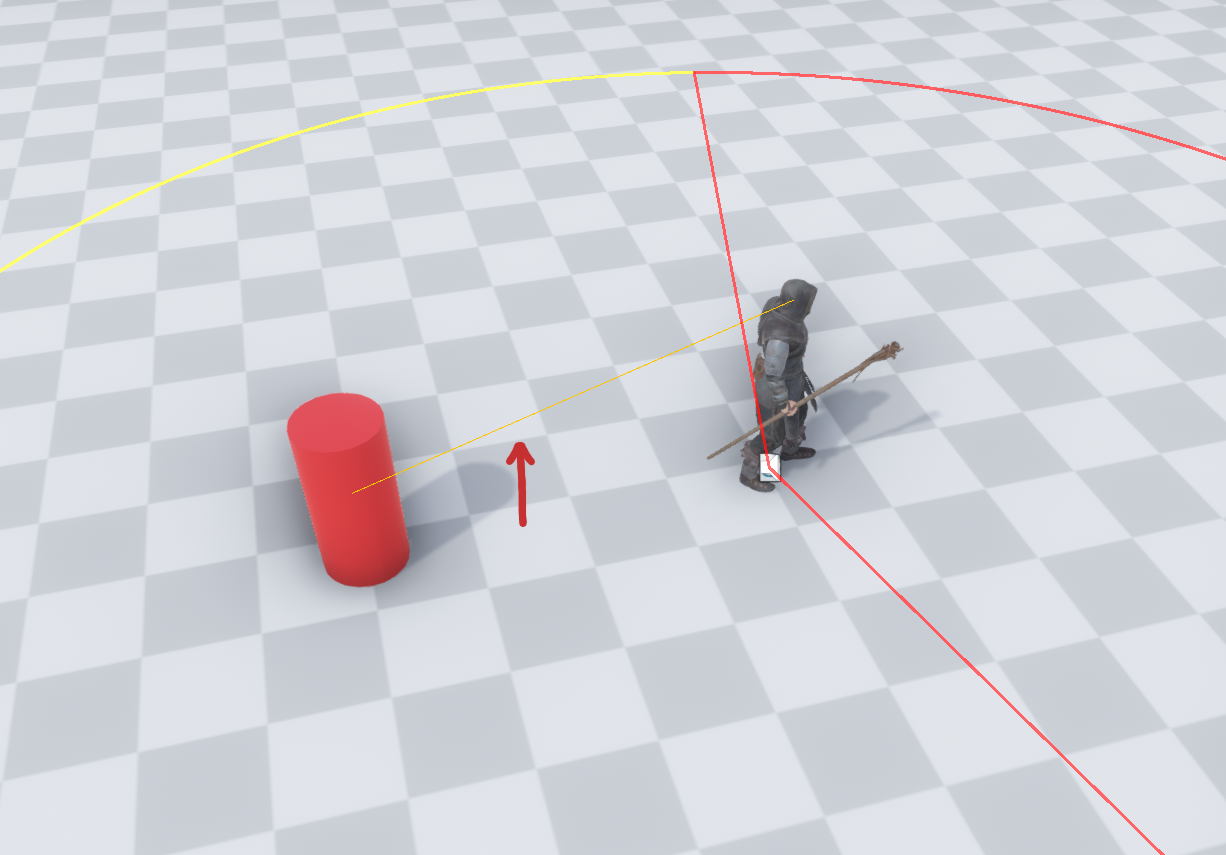
The Debugger Component allows users to see lots of internal functionality and useful information to help identify issues or bugs. This includes target the current information, the AI's current Nav Mesh path, line of sight, current obstructions, look at points and positions, and more.&#x20;

To use the Debugger, ensure that the Emerald Debugger Component is on an AI and that Enable Debugging Tools is enabled. By default, all settings are enabled, but users can choose which settings they'd like enabled. &#x20;

{% hint style="success" %}
Here are the available tutorials and guides for the Debugger Component.
{% endhint %}

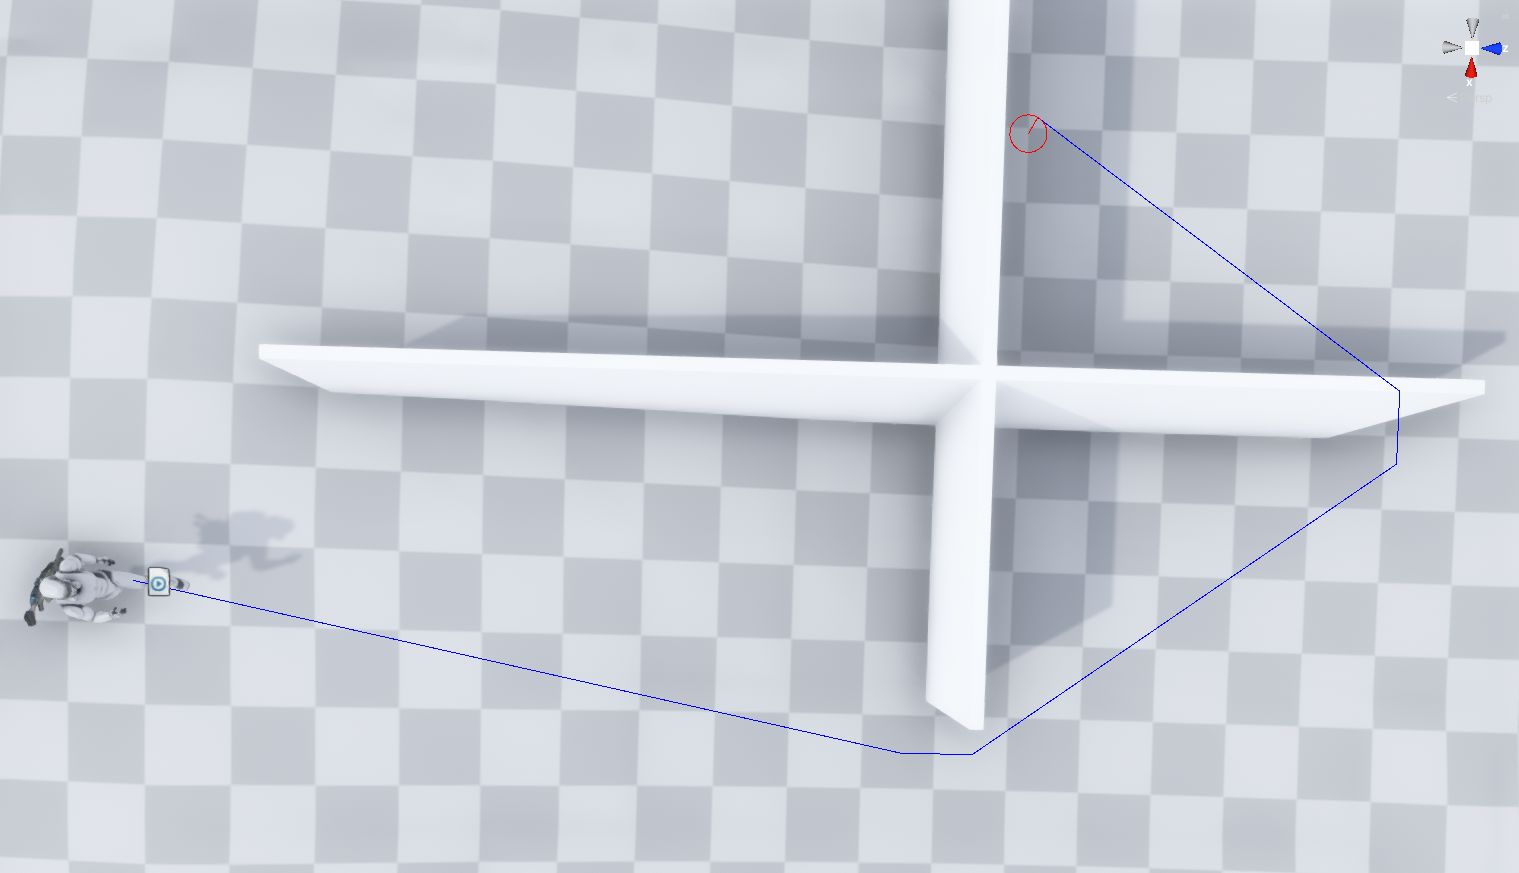
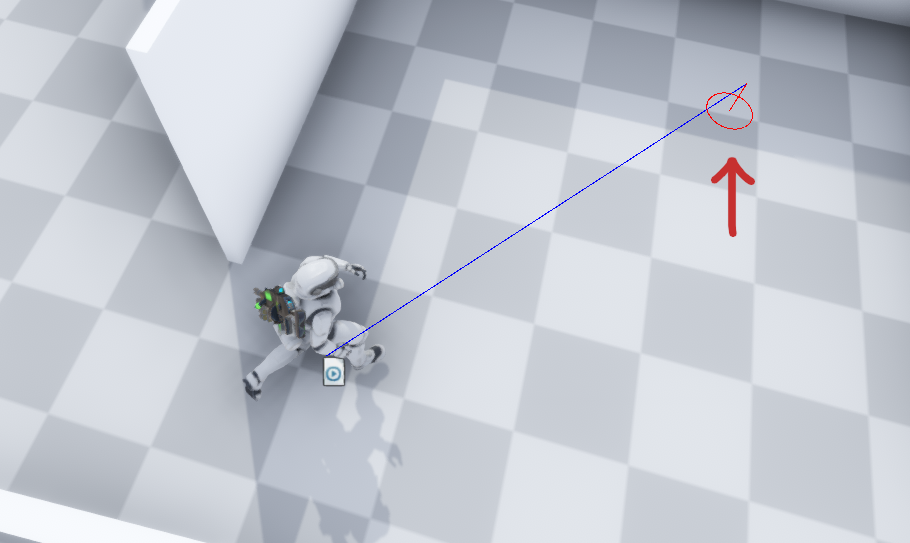
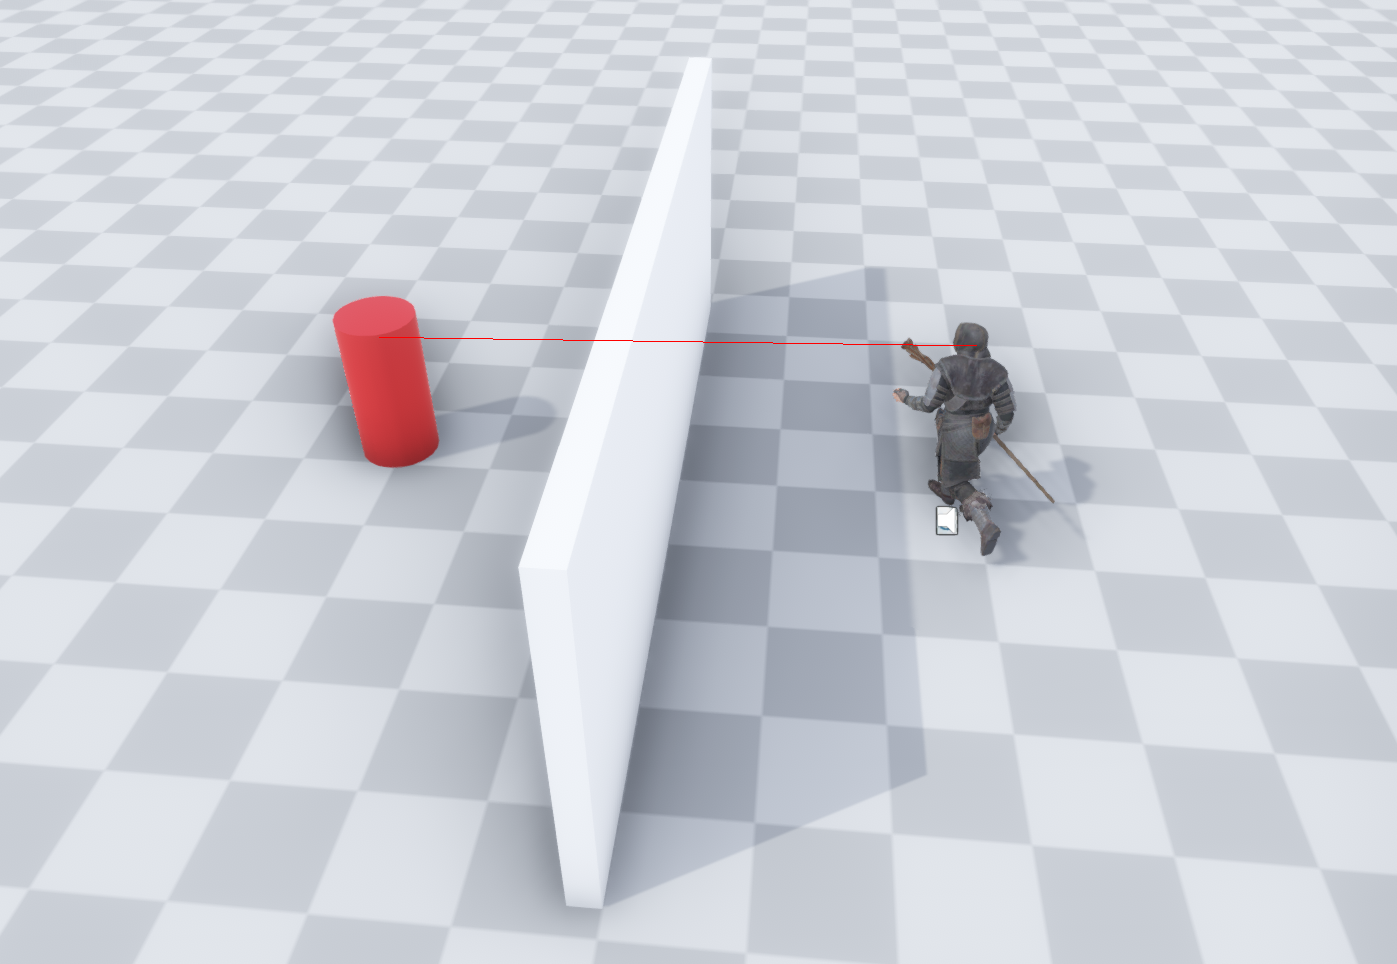
<table data-view="cards"><thead><tr><th></th><th></th><th></th><th data-hidden data-card-cover data-type="files"></th><th data-hidden data-card-target data-type="content-ref"></th></tr></thead><tbody><tr><td></td><td><p>           Applying the</p><p>    Debugger Component</p></td><td></td><td><a href="/files/h18MmeA6LBO15I5PSfk5">/files/h18MmeA6LBO15I5PSfk5</a></td><td><a href="/pages/oS9OqR9NUVy96Rpg73Wv">/pages/oS9OqR9NUVy96Rpg73Wv</a></td></tr><tr><td></td><td>    Drawing an AI's Path</td><td></td><td><a href="/files/Zkr8YzTgMK7t9tWaZ9k3">/files/Zkr8YzTgMK7t9tWaZ9k3</a></td><td><a href="/pages/Jmohw93O7fH9MhzCiyQy">/pages/Jmohw93O7fH9MhzCiyQy</a></td></tr><tr><td></td><td><p>           Drawing an </p><p>        AI's Destination</p></td><td></td><td><a href="/files/wluxMXdiomA2kXYl6TAd">/files/wluxMXdiomA2kXYl6TAd</a></td><td><a href="/pages/m4PniRy7hnA9kWYzSDK3">/pages/m4PniRy7hnA9kWYzSDK3</a></td></tr><tr><td></td><td><p>           Drawing an </p><p>       AI's Line of Sight</p></td><td></td><td><a href="/files/be9pOoGkVKnqjFM4RC4N">/files/be9pOoGkVKnqjFM4RC4N</a></td><td><a href="/pages/XVxXIcSnR9ToyBrip9XQ">/pages/XVxXIcSnR9ToyBrip9XQ</a></td></tr><tr><td></td><td><p>         Drawing an AI's  </p><p> Undetected Targets Line</p></td><td></td><td><a href="/files/PkLDIpRM3lmPNVg88HQa">/files/PkLDIpRM3lmPNVg88HQa</a></td><td><a href="/pages/BqFIHcyNAEy2nFB6QS0b">/pages/BqFIHcyNAEy2nFB6QS0b</a></td></tr><tr><td></td><td>      Debug Log Targets</td><td></td><td><a href="/files/CFmvk5KNkOjmG7xSrmdR">/files/CFmvk5KNkOjmG7xSrmdR</a></td><td><a href="/pages/BCHekWAsoBlIpYFmutOW">/pages/BCHekWAsoBlIpYFmutOW</a></td></tr><tr><td></td><td><p>            Debug Log </p><p>     Current Obstruction</p></td><td></td><td><a href="/files/ducZsRfAWEwquJ9SXSSK">/files/ducZsRfAWEwquJ9SXSSK</a></td><td><a href="/pages/EtsXmztW1qZOmceeZPTg">/pages/EtsXmztW1qZOmceeZPTg</a></td></tr></tbody></table>

{% hint style="warning" %}
**Important:** While Debugger Component is helpful, it's worth noting that performance while using it will be less than if not using it. When you are done debugging, you can keep the Debugger Component on your AI and disable the Enable Debugging Tools setting until it's needed or remove it from the AI entirely. When Enable Debugging Tools is disabled, it will not affect performance and completely disable the Debugger Component.
{% endhint %}


---

# Agent Instructions: Querying This Documentation

If you need additional information that is not directly available in this page, you can query the documentation dynamically by asking a question.

Perform an HTTP GET request on the current page URL with the `ask` query parameter:

```
GET https://black-horizon-studios.gitbook.io/emerald-ai-wiki/emerald-components-optional/debugger-component.md?ask=<question>
```

The question should be specific, self-contained, and written in natural language.
The response will contain a direct answer to the question and relevant excerpts and sources from the documentation.

Use this mechanism when the answer is not explicitly present in the current page, you need clarification or additional context, or you want to retrieve related documentation sections.